
Bitcoin slipped 3.21% in the past day after bumping into resistance near $64,600, the same ceiling that turned buyers away a week earlier. That rejection triggered $373.58 million in liquidations across the broader market, with Bitcoin alone accounting for $107.32 million split between long and short positions.
For anyone tracking the charts closely, the pattern feels familiar, and it raises a question a lot of Bitcoin investors have been asking lately: is this the start of something bigger, or just another shakeout on the way to higher ground?


Bitcoin Investors Face a Familiar Resistance Wall
The rejection at $64,600 was not a surprise as this zone has acted as a lid on price twice now, and each time it produced a wave of selling that ripples through the derivatives market. Analysts had already flagged rising fear in sentiment gauges, largely because activity in futures and perpetual contracts kept climbing while actual spot demand stayed thin. That gap between paper trading and real buying tends to catch up with price sooner or later, and this time it did.
Leverage Unwind, Not Panic Selling
Here is where the picture gets more nuanced. Wallets holding between 100 and 1,000 BTC sold roughly 67,000 coins on July 13, a chunk of supply large enough to move markets on its own. Yet analyst Axel Adler Jr. pointed out that open interest fell right alongside price during the decline, which usually points to traders closing out leveraged long bets rather than aggressively piling into new short positions.
This looks more like a cleanup than a stampede. Bitcoin investors who lived through the 2022 credit unwind will recognize the difference between forced deleveraging and genuine capitulation, and right now the data leans toward the former.
What the Pressure Index Reveals
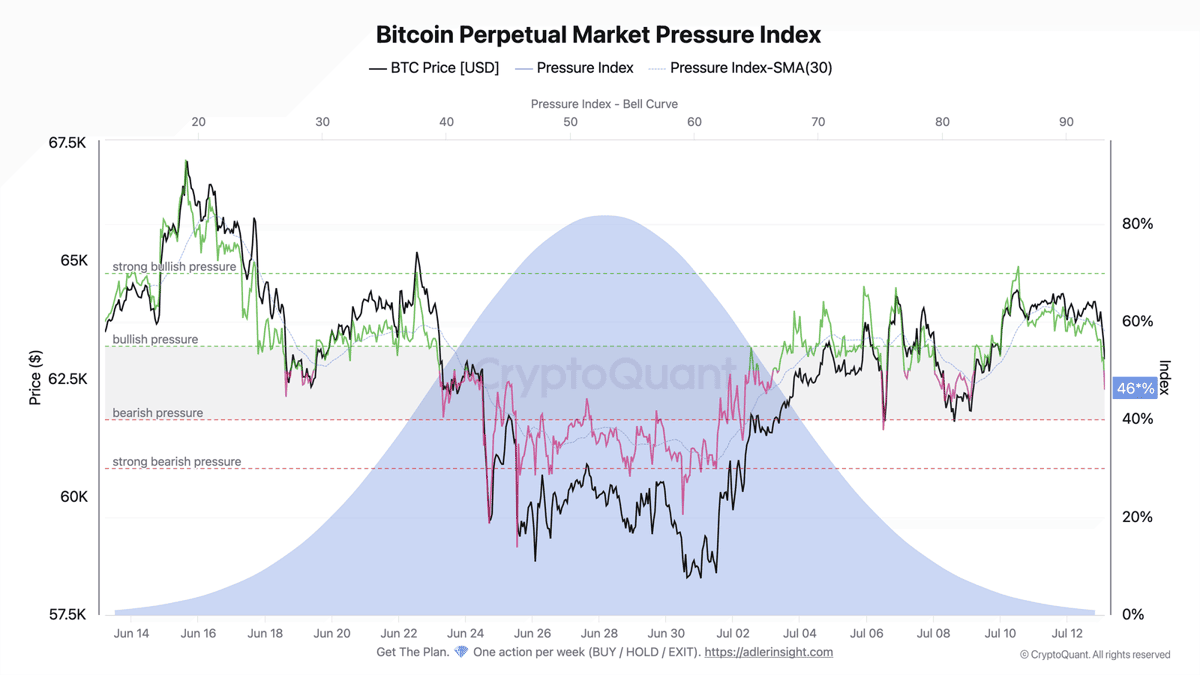
Adler tracks a composite metric called the Bitcoin Perpetual Market Pressure Index, which blends price action, net taker flow, open interest, and volume delta into a single reading between 0 and 100. That number dropped 11 points to 46 in just over a day, falling from 61 and slipping below the 30-day moving average of 58.
Buying pressure has clearly softened, and until the index reclaims that average, momentum traders are likely to stay cautious. It is not a red alarm, but it is a yellow flag worth watching for anyone managing risk right now.
Stablecoin Reserves Hint at a Waiting Game
Away from the short-term charts, a longer-term signal is quietly building. Analyst Moreno, writing on CryptoQuant, noted that Bitcoin’s reserve ratio against stablecoins on Binance just hit its lowest point of the entire cycle.
Exchange-held BTC balances sit at only 8 to 9 percent of total holdings, while stablecoin firepower keeps stacking up on the sidelines. That imbalance tells its own tale. Plenty of Bitcoin investors are holding cash equivalents rather than deploying them, effectively waiting for a better entry point instead of chasing price at current levels.
The $42,429 Level That Has Everyone Talking
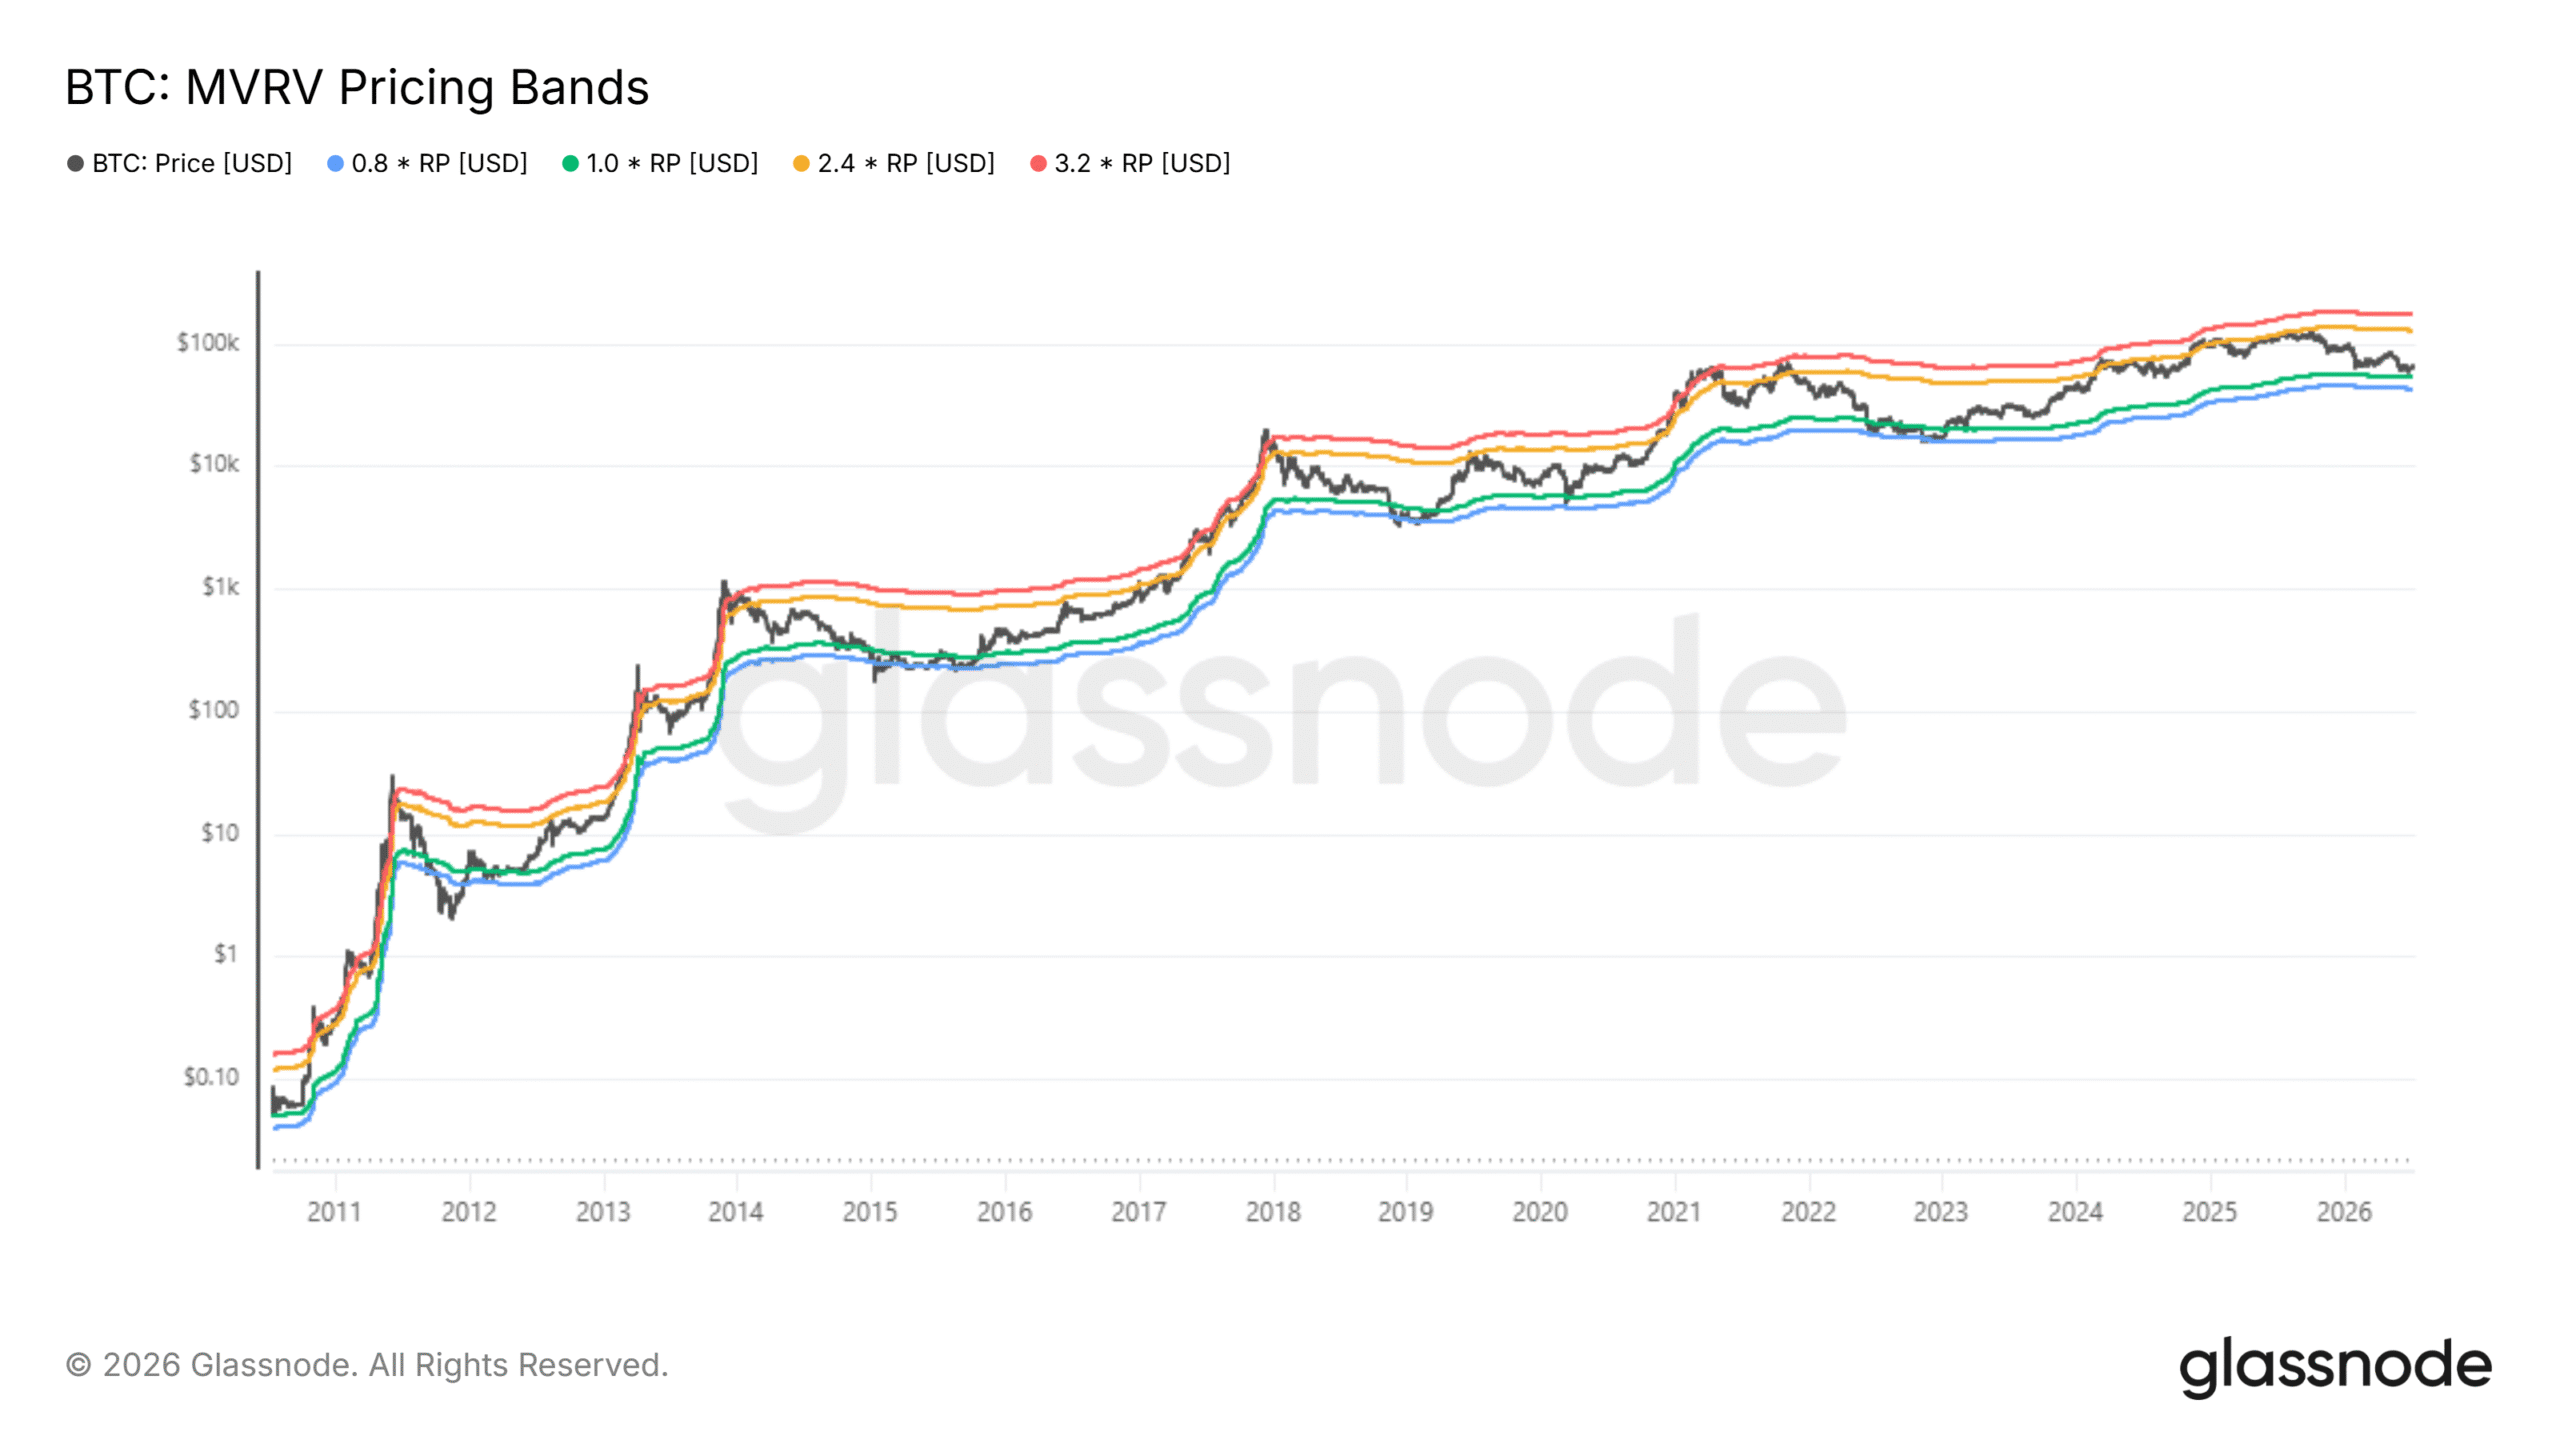
The number drawing the most attention comes from Glassnode’s MVRV pricing bands, a tool that compares current price against the average cost basis of holders across the network. Historically, each market cycle has bottomed near 0.8 times that cost basis before staging a recovery.
As of this writing, that band sits at $42,429. It is not a prediction that price will fall that far, but it does explain why some defensive Bitcoin investors seem content to sit on their hands. They have seen this movie before, and they would rather buy the dip than chase the rally.
What This Means for the Weeks Ahead
The next stretch matters as much as the last day did. If the pressure index climbs back above its 30-day average, momentum could return fast, and Bitcoin investors on the sidelines might not get the discount they are hoping for. If spot demand keeps lagging instead, the path toward the lower cost-basis band gets more realistic. Either way, this looks like a setup where patience pays off better than chasing a bounce, and many Bitcoin investors seem to be treating it that way.
Conclusion
None of this points to panic as the current pullback looks like a controlled release of excess leverage rather than the beginning of an aggressive downtrend, and the derivatives data backs that up. Still, the combination of weak spot demand, a cooling pressure index, and stacked stablecoin reserves suggests plenty of Bitcoin investors are choosing patience over urgency. Whether price actually revisits $42,429 remains to be seen, but the setup gives a clear window into how disciplined market participants are thinking heading into the next few weeks.
Frequently Asked Questions
Why did Bitcoin drop after hitting $64,600?
Bitcoin faced rejection at a resistance zone that had already stopped buyers once before, triggering profit-taking and leveraged liquidations across the market.
Is the current sell-off considered dangerous?
Not according to analysts. Falling open interest alongside price suggests long positions were closed rather than new aggressive shorts being opened.
What does the Bitcoin Perpetual Market Pressure Index measure?
It combines price, taker flow, open interest, and volume delta into one score to gauge whether buyers or sellers are in control.
Why does $42,429 matter to Bitcoin investors?
It reflects the 0.8x MVRV band, a level near the average cost basis where past cycles have historically bottomed before recovering.
What do low stablecoin reserves on exchanges suggest?
They indicate available buying power is building up, with investors likely waiting for lower prices before deploying capital.
Glossary of Key Terms
Open Interest: The total value of outstanding derivatives contracts that have not been settled or closed.
Liquidation: The forced closing of a leveraged trading position when losses exceed available margin.
MVRV Ratio: A metric comparing Bitcoin’s market value to its realized value, used to assess whether the asset is overvalued or undervalued relative to holder cost basis.
Reserve Ratio: A measure of an exchange’s stablecoin holdings against its Bitcoin balances, often used to gauge available buying power.
Perpetual Contract: A type of derivative that lets traders speculate on price without an expiration date, commonly used with leverage.
Disclaimer: This article is for informational purposes only and should not be interpreted as financial or investment advice.
Sources